
Every day, numerous reusable items are needlessly discarded. To cultivate a culture centered on waste reduction, reuse, sharing, and repairing in Toronto, the City is introducing five Community Reduce & Reuse Programs.
The urgency of the climate crisis looms larger with each passing year, fueled by escalating greenhouse gas (GHG) emissions and the relentless march of global warming.
Ready to take meaningful steps in the battle against climate change but unsure where to start? Look no further! Tomorrow’s Dream stands ready to support individuals and community groups eager to address climate challenges head-on.
volunteers participate annually in tree planting and stewardship events.
of Toronto residents participate in recycling programs, contributing to the city's sustainability efforts.
The city has invested $10 million in green infrastructure projects aimed at enhancing urban biodiversity.
Ready to take meaningful steps in the battle against climate change but unsure where to start? Look no further! Tomorrow’s Dream stands ready to support individuals and community groups eager to address climate challenges head-on.
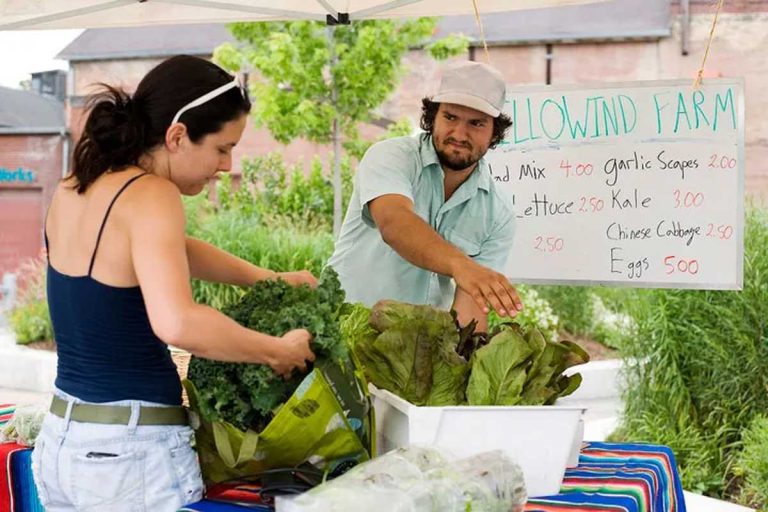
Toronto has a profound affinity for cuisine, and it’s not unexpected given our proximity to some of Canada’s most fertile agricultural regions. Our city takes pride in its culinary diversity, considering it one of our paramount strengths.
However, amidst a constantly expanding array of culinary options, the environmental repercussions of our culinary passion are substantial and on the rise. To sustain Toronto’s progress in sustainability, enhance economic prosperity, and bolster food security, it’s imperative that we reassess our connection with food in this ever-evolving era of choices.
…
Transportation stands as the second-largest contributor to greenhouse gas (GHG) emissions in Toronto, comprising 33 percent of the total emissions. The usage of fossil fuels to power cars, trucks, ships, trains, and planes leads to GHG emissions. A significant portion (70 percent) of transportation emissions originates from personal vehicles such as cars, vans, SUVs, and light trucks utilized by individuals or households.
To align with our 2030 reduction targets and ultimately attain net-zero status by 2040, it is imperative to minimize vehicular trips by transitioning to walking, cycling, or using public transit. Simultaneously…

